Skip to content
Research | Policy Advisory | Governance Solutions

Public Policy Consulting Firm in India: Governance Advisory.

Political Metrics is a public policy consulting and governance advisory firm in India, providing evidence-based research, policy analysis and practical solutions for better governance. We support political leaders, elected representatives, institutions and public bodies through government scheme evaluation, policy research, governance assessment and public service delivery analysis. Our research-driven approach helps identify development priorities, understand public needs and strengthen policy implementation for inclusive development across India.

Policy Research & Analysis
Scheme Impact Assessment
Governance Advisory
Implementation Support
Discuss Your Policy Requirements →
Public Policy · Scheme Evaluation · Governance Advisory · Service Delivery · Inclusive Development
Public policy and governance consulting in India

Policy decisions, grounded in evidence.

Political Metrics supports governments, legislators, public bodies and policy institutions with research, scheme evaluation, delivery tracking and citizen feedback, so that policy design and governance reform rest on structured, checkable evidence.

Policy researchScheme evaluationDelivery trackingCitizen feedback
Governance Delivery OverviewIllustrative layout, sample values only
DEMO DATA
Schemes tracked12Sample set
Districts compared30Sample set
Service indicators18Defined
Feedback waves04Longitudinal
Scheme coverage by quarter (sample)
80604020Q1Q2Q3Q4
Budget use (sample)

Illustrative sample dashboard. Not live information, official statistics or a performance claim.

Our Expertise

Public Policy and Governance Expertise for Real-World Challenges.

Good policy begins with understanding the issues people face and how government programmes work on the ground. Political Metrics brings together policy research, governance advisory, data analysis and citizen feedback to help public institutions make informed decisions. From evaluating government schemes to identifying gaps in public service delivery, our work focuses on practical insights and solutions that can make a meaningful difference.

Research

Policy research and briefs

Literature review, comparison of state and national practice, and short briefs on a defined policy question.

Design

Policy and scheme design

Define objectives, eligibility, delivery model and indicators, with assumptions stated openly.

Evaluation

Scheme and programme evaluation

Assess coverage, outcomes and cost against stated objectives, with method and limits documented.

Options

Policy option appraisal

Compare alternatives on agreed criteria, cost and feasibility, with sensitivity checks.

Monitoring

Delivery monitoring

Track applications, sanctions, payments and turnaround time to show where delivery slows.

Fiscal

Budget and expenditure analysis

Read allocations, releases and utilisation across schemes, departments and periods.

Reform

Governance and process diagnostics

Map departmental processes, find bottlenecks and propose practical reforms.

Citizens

Citizen feedback and service surveys

Household and user surveys on access, quality and satisfaction, with documented sampling.

Grievances

Grievance data analysis

Group complaints by theme, office and area to find repeat problems and root causes.

Consultation

Stakeholder consultation

Structured consultations with officials, experts and communities, summarised with clear records.

Dashboards

District and department dashboards

Filtered views with defined indicators for regular review by officials.

Capacity

Training and capacity building

Workshops on evidence use, data literacy and monitoring for teams in public bodies.

Turning Research into Better Decisions

Connect policy intent to what happens on the ground.

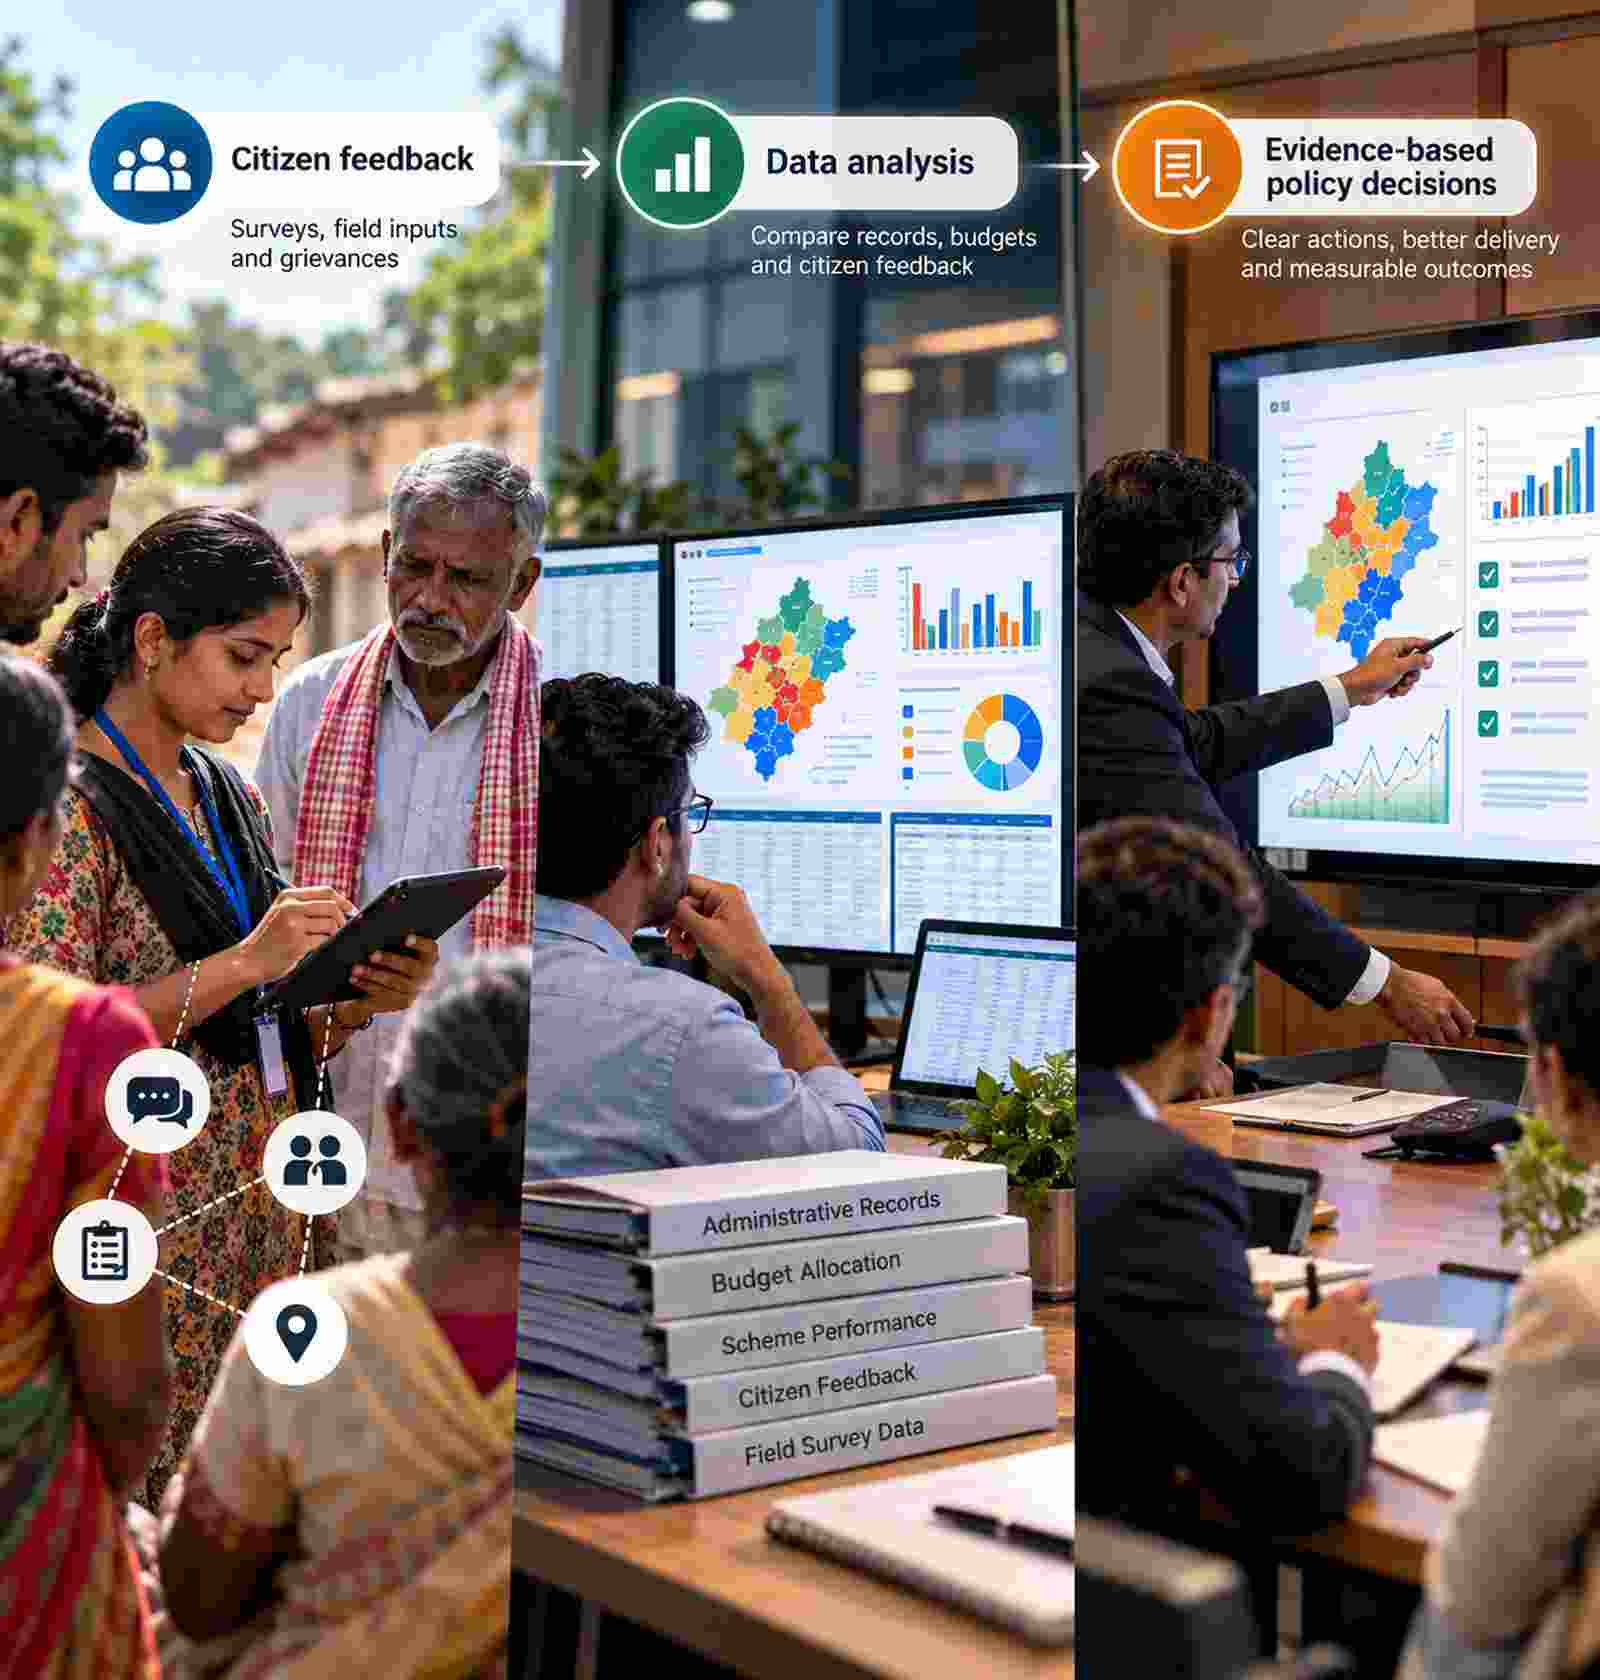
Policies are judged by delivery and outcomes. Comparing administrative records, budgets and citizen feedback side by side helps teams see where a scheme works, where it stalls and what to examine next.

Clear objectivesEvery analysis starts from the decision and the indicators it needs.
Delivery dataRead records, budgets and turnaround times across places and periods.
Citizen voiceAdd survey and grievance evidence to administrative data.
Transparent methodAssumptions, sources and limits are listed in every report.

The result is a practical base for decisions: what changed, where, which signals appear connected, and what to verify before acting.

Citizen feedback and data analysis informing public policy decisions in India
Policy, delivery and evidence
How We Work

A Clear Path from Research to Action.

We begin by understanding the issue and the decision that needs to be made. Then we gather relevant information, test what the evidence shows and present practical recommendations that teams can use.

01

Frame the question

Define the decision, geography, period and indicators.

02

Gather the evidence

Review records, budgets, literature, surveys and field inputs.

03

Analyse and test

Check data gaps, compare options and test assumptions.

04

Recommend and review

Present findings, limits and next steps, then refine with the client.

Data sources, access and timelines are confirmed per engagement. Associations in data do not establish causation.

Who We Work With

Supporting Institutions in Better Governance.

We work with public institutions and their partners to understand local challenges, review programme performance and make decisions based on reliable evidence. Each engagement is shaped around the client’s priorities, the area being studied and the information available.

Government

State departments

Evaluate schemes, track delivery and review service performance across districts.

Legislators

MLAs and MPs

Assess constituency needs, development priorities and scheme coverage in your area.

Local bodies

ZP and municipal bodies

Read ward and block-level service data, budget use and citizen feedback.

Research

Think tanks and research institutions

Survey design, fieldwork and data analysis support for policy research.

Development

NGOs and CSR foundations

Programme evaluation, impact assessment and reporting for funders and partners.

Policy Focus Areas

Research and Governance Insights Across Key Sectors.

Every sector has its own policy and delivery challenges. We use research, data and feedback from the ground to understand these issues and identify areas for improvement. The examples below illustrate the kind of questions we can explore with each client.

Health

Public health services

Example questionWhich blocks have the weakest access to primary health centres?

Education

School education

Example questionWhich blocks lag on school enrolment and retention?

Agriculture

Agriculture and rural development

Example questionAre farm support schemes reaching small and marginal farmers?

Water

Water and sanitation

Example questionWhere do households still lack reliable drinking water?

Urban

Urban governance

Example questionWhich wards see repeat civic complaints, and why?

Welfare

Social welfare

Example questionAre pensions and benefits reaching eligible households on time?

Livelihoods

Jobs and skills

Example questionDo skilling programmes lead to local employment?

Enterprise

MSMEs

Example questionWhich licensing or credit steps slow small business growth?

Illustrative Research and Analytics

See How Policy Research Can Turn Data into Useful Insights.

Explore examples of policy evaluation, scheme delivery tracking, budget analysis and citizen feedback. These sample exhibits show how information can be organised to help public institutions identify gaps and ask better questions. All figures are illustrative and are not official statistics.

Exhibit 1

Scheme outcomes differ widely across districts

Sample outcome index by district, before and after rollout

DistrictEligible householdsEnrolledOutcome index (before)Outcome index (after)
District A1,20,00086%4261
District B94,50071%4552
District C1,48,20058%3941
District D76,30092%4766

Sample values. A real evaluation states its comparison group, data sources and limits.

Analytical question: Is the change linked to the scheme, or to other factors in the same period?
Exhibit 2

Cost per beneficiary falls as enrolment rises

Sample cost per beneficiary (Rs) against enrolment

90030050%70%90%
Read with care: the highlighted outlier needs a local check before any conclusion.
Exhibit 3

Policy options compared on stated criteria

Sample option appraisal, indicative scores out of 5

Option A
4.2
Option B
3.4
Option C
2.6

Weights and criteria are agreed with the client and shown openly.

Analytical question: Would the ranking change if the weights changed?
Exhibit 4

Scheme delivery tracker: where applications stall

Sample application pipeline, one district

Applications18,400Sample
Verified81%14,900
Sanctioned63%11,600
Median days27Target 21
Applied18,400
Verified14,900
Sanctioned11,600
Paid9,570
Analytical question: Which stage loses the most applicants, and in which blocks?
Exhibit 5

Service-level gaps against target

Sample share of cases resolved within target time

Certificates
88%
Pensions
71%
Ration cards
64%
Land records
49%
Analytical question: Which services need process review first?
Exhibit 6

Budget release and utilisation by quarter

Sample, Rs crore

80400Q1Q2Q3Q4
ReleasedUtilised
Analytical question: Is the gap a delay in spending or a delay in release?
Exhibit 7

Citizen satisfaction varies by service and by area

Sample n=2,400 households, margin of error ±2.0%

Wave 2Household surveyRural + urban
Public health
62%
School education
56%
Drinking water
46%
Roads
36%

Methodology, sampling and weights are documented in a real report.

Read with care: a gap inside the margin of error is not a real difference.
Exhibit 8

Grievance themes cluster around a few offices

Sample share of grievances by theme

Delay
38%
Non-response
26%
Eligibility
17%
Other
19%
Analytical question: Which offices account for repeat grievances?
Exhibit 9

Monthly governance brief: what officials receive

Sample one-page summary

Alert 1 Pension approvals in Block X are 12 days over target.

Alert 2 Fund utilisation in Scheme Y is below plan.

Alert 3 Grievances on water supply rose for three weeks.

Output: a PDF or email each month.
Exhibit 10

Allocation, release and spending differ by sector

Sample sector budget view, Rs crore

SectorAllocatedReleasedSpentSpent / released
Health42038031082%
Education56052047090%
Water supply31024015063%
Roads28026020579%

Sample values. Real work uses official budget documents and states the period covered.

Analytical question: Is low spending caused by late release, approvals or capacity?
Exhibit 11

Older pending certificates need follow-up first

Sample pending utilisation certificates by age (count)

0-30 days
42
31-90 days
27
91-180 days
14
180+ days
9
Analytical question: Which departments hold the oldest pending items?
Exhibit 12

Cost per beneficiary varies across schemes

Sample cost per beneficiary (Rs)

Scheme A
1,200
Scheme B
2,450
Scheme C
860
Scheme D
3,100

Cost alone is not value. Read it with coverage and outcomes.

Read with care: schemes with different goals are not directly comparable.
Exhibit 13

Ward development gap index: three wards trail the rest

Sample ward comparison, one constituency, higher gap = greater need

WardHouseholdsWater accessRoad conditionSchool accessGap index
Ward 14,20091%Good88%18
Ward 23,85064%Poor72%56
Ward 35,10078%Fair81%34
Ward 42,96052%Poor69%67

Sample values. A real index lists each indicator, its source and its weight.

Analytical question: Which wards need attention first, and what is driving the gap?
Exhibit 14

Priority works ranked on stated criteria

Sample priority score out of 100

Drinking water line
86
Drainage
74
Road repair
63
PHC upgrade
51

Criteria, such as households affected and cost, are agreed and shown openly.

Analytical question: Does the ranking hold if the criteria weights change?
Exhibit 15

Service access heatmap by ward

Sample share of households with access

WaterRoadsSchoolHealthW191888876W264587261W378748170W452496955
HighMediumLowCritical
Analytical question: Where do several gaps overlap in the same ward?

PS: All data shown in these exhibits is fictional and for illustration only. Figures, districts and schemes are not official statistics or results from any client.

Frequently asked questions

Answers before you start.

How policy research, evaluation and governance consulting work at Political Metrics.

It is research and advisory support for policy design, scheme evaluation and administrative reform. The aim is to help public institutions decide using evidence rather than assumption.

No. Every exhibit uses fictional sample data to show layouts and the questions they answer. They are not official statistics or a performance claim.

We work with government departments, elected representatives, public bodies, think tanks, civil society organisations and research institutions, depending on the scope of the project.

Administrative and scheme records, budget documents, official statistics, household and user surveys, grievance data and field consultations. What is available depends on access, permissions and data quality.

We set the objectives and indicators with the client, compare coverage, outcomes and cost across places and periods, and state the comparison method and its limits. We avoid claiming a scheme caused a change unless the design supports it.

Reports use aggregate data only. Surveys follow informed consent and data-protection practice, and we do not publish individual-level information.

The policy question, the geography and period, the decision it will inform, and access to relevant records. From there we confirm sources, scope, timeline and outputs.

We work across health, education, agriculture and rural development, water and sanitation, urban governance, social welfare, jobs and skills, and MSMEs. Scope is agreed with each client.

Yes. We support state departments, MLAs and MPs, ZP and municipal bodies, think tanks, NGOs and CSR foundations, with scope set to the decision each client needs to make.

Make Better-Informed Policy and Governance Decisions.

Talk to Political Metrics about public policy research, governance advisory, government scheme evaluation or citizen feedback research. We can discuss your objectives and identify an approach suited to your project.

Sample exhibits are illustrative. Actual reporting depends on data access, permissions and agreed scope.

Discuss a policy project
All it starts with communication

Come visit us!

Political Metrics is a India’s leading political strategy consulting firm specialises in Political PR, Surveys (pre,exit & post poll), Election Campaign Management, Political Party Registration, Political Advisory, Campaign War Room, Political Intelligence, Analytics, Digital & Social Media Management.

You can also have a chat with us on WhatsAppÂ