Skip to content
CATI Surveys | Political & Market Research | India

Understanding Public Opinion Through CATI Surveys.

Reach respondents across India through structured telephone surveys and computer-assisted interviewing. CATI (Computer-Assisted Telephone Interviewing) enables systematic data collection, real-time response recording and efficient survey monitoring. Political Metrics provides CATI survey services for political research and commercial market research, helping political parties, businesses, research organisations and institutions understand public opinion, voter preferences, consumer behaviour, market trends and customer perceptions.

Computer-Assisted Telephone Interviews
Pan-India Survey Coverage
Political & Market Research
Real-Time Data Monitoring
Discuss Your CATI Survey Requirements →
CATI Survey Agency India · Political Surveys · Market Research · Consumer Research · Public Opinion Polling · Telephone Surveys
CATI Survey Company in India

Understanding People Through Better Telephone Surveys.

Political Metrics provides CATI (Computer-Assisted Telephone Interviewing) services for political research and commercial market research across India. Our survey teams conduct structured telephone interviews to understand public opinion, voter preferences, consumer behaviour, customer satisfaction and market trends. Responses are recorded through computer-based questionnaires, helping research teams organise and review survey data in a consistent way.

CATI Survey Services Political Research Market Research India-wide Surveys
CATI Survey Operations Dashboard Illustrative layout · Sample values only
DEMO DATA
Calls attempted12,480Sample
Completed interviews8,760Sample
Completion rate70.2%Sample
Quality checked1,240Sample
Daily interview progress
800 600 400 200 Mon Tue Wed Thu
Call status mix
CALLS STATUS

Sample dashboard only. Figures are illustrative and do not represent actual survey operations or completed client projects.

CATI Survey Services

Telephone survey services for political and market research.

CATI makes it possible to reach respondents over the telephone using a structured questionnaire. Political Metrics supports different types of research, from voter opinion surveys to consumer and customer studies. Each survey is planned around the research objective, sample requirements, questionnaire and reporting needs.

Political research

Political Opinion Surveys

Conduct telephone surveys to understand public opinion, voter preferences, local issues and views on public affairs.

Election research

Pre-Poll and Post-Poll Surveys

Collect responses before and after elections to study voting preferences, issue awareness and changes in opinion.

Public opinion

Public Opinion Research

Understand how people view government programmes, public services, current issues and social developments.

Commercial research

Market Research Surveys

Gather feedback on products, services, market preferences and changing consumer needs through telephone interviews.

Consumer research

Consumer Behaviour Studies

Understand buying habits, product usage, brand awareness and the factors people consider before making a purchase.

Customer experience

Customer Satisfaction Surveys

Ask customers about their experience, service quality, expectations and areas where businesses can improve.

Brand research

Brand Awareness and Perception

Measure brand familiarity, customer opinions, brand recall and responses to new products or services.

Product research

Product and Concept Testing

Collect feedback on new products, proposed services, advertising concepts and product features.

Institutional research

Corporate and Institutional Surveys

Conduct structured telephone interviews for organisations, research institutions and public or private sector projects.

How CATI Surveys Work

From questionnaire design to final survey report.

Every CATI survey follows a planned process. The questionnaire, respondent sample, calling process and quality checks are decided before the interviews begin.

01

Research Planning

Understand the research objective, target respondents, sample size, geography and survey duration.

02

Questionnaire Setup

Prepare the questions and programme them into a computer-assisted telephone interview system.

03

Telephone Interviews

Trained interviewers make calls, ask the questions and record responses in the survey system.

04

Data Review and Reporting

Review responses, check data quality and prepare survey summaries, tables and dashboards.

Survey scope, respondent lists, languages, sample design and reporting frequency are agreed for each project.

Computer-Assisted Telephone Interviewing

A structured way to listen to people across India.

CATI stands for Computer-Assisted Telephone Interviewing. An interviewer speaks to a respondent over the phone while following a questionnaire displayed on a computer. The answers are recorded directly into the survey system.

This approach helps research teams follow the same set of questions, monitor completed interviews and review survey progress without waiting for paper questionnaires to be collected and entered later.

Structured interviews Every interviewer follows the agreed questionnaire.
Direct data recording Responses are entered into the system during the call.
Progress monitoring Track completed calls, pending interviews and callbacks.
Quality review Review interview records and identify incomplete responses.

CATI can be used for political surveys as well as market, consumer, customer satisfaction and institutional research.

Political Metrics CATI survey data reporting and analytics dashboard
Illustrative survey data and reporting dashboard
CATI Survey Dashboards

See how CATI survey data can be monitored and presented.

A CATI project generates several types of information. These sample dashboards show how survey progress, respondent profiles, call outcomes, research responses and interview quality can be presented in one place. Select each tab to explore the different views.

Exhibit 1

CATI survey progress at a glance

Illustrative project overview

Target interviews10,000Planned
Completed7,25072.5%
Pending2,750Remaining
Active interviewers35Sample
10K 7.5K 5K 2.5K 0 Day 1 Day 5 Day 10 Day 15
Dashboard view: Compare the planned sample with the number of interviews completed during the survey period.
Exhibit 2

Daily completed interviews

Sample daily calling output

Monday
820
Tuesday
910
Wednesday
710
Thursday
980
Friday
860
Dashboard view: Check daily output and identify changes in calling activity.
Exhibit 3

Interview progress by region

Illustrative regional sample completion

North
82%
South
73%
East
65%
West
90%
Central
70%
Dashboard view: Compare progress across regions and survey locations.
Exhibit 4

Respondent profile and sample composition

Illustrative aggregate respondent profile

Total respondents7,250Sample
Age groups05Segments
Survey regions12Sample set
Languages06Sample set
18–25 years
16%
26–35 years
28%
36–45 years
25%
46–60 years
20%
60+ years
11%
Dashboard view: Understand the age composition of completed interviews.
Exhibit 5

Sample distribution by region

Illustrative respondent share

100%
  • North40%
  • South24%
  • East20%
  • West16%
Dashboard view: Review respondent coverage by region.
Exhibit 6

Sample targets and actual interviews

Illustrative target comparison

N1N2S1S2E1E2 W1W2C1C2C3N3
Target met In progress Needs review
Dashboard view: Identify sample groups that need additional interviews.
Exhibit 7

Telephone call outcomes

Illustrative calling status report

Calls attempted12,480Sample
Completed8,760Interviews
Callbacks1,120Pending
No answer1,540Sample
CALL STATUS
  • Completed69%
  • Busy9%
  • No answer13%
  • Other outcomes9%
Dashboard view: See how attempted calls are distributed across different outcomes.
Exhibit 8

Callback status

Sample pending follow-ups

Callback requested1,120
Called again840
Completed610
Dashboard view: Check which callbacks are still pending.
Exhibit 9

Calling activity by time

Illustrative completed calls by time slot

9 AM–11 AM
64%
11 AM–1 PM
88%
1 PM–3 PM
55%
3 PM–5 PM
100%
5 PM–7 PM
79%
Dashboard view: Compare activity across calling time slots.
Exhibit 10

Political opinion survey: responses to key issues

Illustrative respondent selections

Completed interviews2,500Sample
Questions18Questionnaire
Issue categories06Sample
Survey waves03Sample
Employment
32%
Local development
26%
Education
19%
Healthcare
14%
Other issues
9%
Sample responses. Categories and results depend on the questionnaire and survey sample.
Dashboard view: Present responses to public opinion and political research questions.
Exhibit 11

Market research: product awareness

Illustrative consumer survey responses

100%
  • Know the brand63%
  • Heard of it24%
  • Not aware13%
Dashboard view: Understand how familiar respondents are with a product or brand.
Exhibit 12

Customer satisfaction survey

Illustrative rating distribution

Very satisfied
42%
Satisfied
35%
Neutral
15%
Dissatisfied
6%
Very dissatisfied
2%
Dashboard view: Present customer feedback in a clear and simple format.
Exhibit 13

Interview quality monitoring dashboard

Illustrative call review and data checks

Interviews reviewed1,240Sample
Complete records1,180Sample
Flagged for review42Sample
Pending checks18Sample
Complete responses
95%
Valid entries
92%
Review completed
88%
Pending review
12%
Dashboard view: Review data completeness and identify records that need another check.
Exhibit 14

Interview duration

Sample duration distribution

Under 3 min
10%
3–5 min
35%
5–8 min
50%
Over 8 min
5%
Dashboard view: Review interview duration and look for unusual patterns.
Exhibit 15

Interviewer activity report

Illustrative completed interviews by interviewer

Interviewer A
145
Interviewer B
130
Interviewer C
120
Interviewer D
110
Dashboard view: Review calling activity alongside interview quality checks.
Exhibit 16

CATI research executive summary

Illustrative combined project report

Target sample10,000Planned
Interviews completed7,250Sample
Data checked6,800Sample
Report status80%Illustrative

Survey progress: Completed interviews are compared with the agreed sample target.

Respondent coverage: Check the sample distribution across the selected regions and groups.

Data quality: Review incomplete records and entries flagged during quality checks.

Research findings: Present the main responses, comparisons and observations.

Dashboard view: A single summary for project managers and research teams.
Exhibit 17

Sample CATI survey report preview

A typical report structure

1. Survey Overview
2. Survey Methodology and Sample
3. Respondent Profile
4. Question-wise Findings
5. Tables, Charts and Key Observations
Output: Survey summary, charts, response tables and agreed reporting formats.

All dashboard values and visualisations are illustrative examples. Actual CATI survey dashboards are prepared using verified project data, the agreed sample and the questionnaire.

Research Applications

One telephone survey method. Different research requirements.

CATI can be used across different sectors. The questions, sample design and reporting change depending on what the organisation wants to understand.

Political sector

Political Parties and Candidates

Voter opinion, public issues, election surveys, candidate awareness and political research.

Consumer sector

Consumer Goods and Retail

Product awareness, brand recall, shopping habits and consumer preferences.

Business sector

Companies and Businesses

Customer feedback, service experience, customer satisfaction and market studies.

Research sector

Research Organisations

Structured telephone interviews for independent research projects and institutional studies.

Public sector

Government and Public Programmes

Public feedback, service awareness and responses to programmes and initiatives.

Brand and product

Marketing and Advertising Teams

Brand perception, advertisement feedback, product testing and customer research.

Choosing a CATI Survey Partner

What matters in a CATI survey company in India?

A good survey project needs more than a team making telephone calls. It needs a clear questionnaire, a suitable respondent sample, organised interviews, regular checks and a report that is easy to understand.

01

Research Planning

A clear understanding of the study, target respondents, sample requirements and questionnaire.

02

Organised Calling

A planned interview process, suitable calling schedules and a structured approach to callbacks.

03

Quality Checks

Review of responses, interview records, missing information and data consistency.

04

Useful Reporting

Clear findings, response tables, charts and dashboards based on the research objectives.

Political Metrics undertakes CATI survey projects for political and commercial research requirements across India.

Frequently Asked Questions

CATI surveys: common questions answered.

Understand how CATI works, where it can be used, and what to consider when selecting a CATI survey company in India.

What is CATI surveying?

CATI stands for Computer-Assisted Telephone Interviewing. It is a survey method in which an interviewer calls a respondent and follows a questionnaire displayed on a computer. The answers are recorded directly into the survey system for later review and analysis.

What is a computer aided telephonic interview?

The phrase is sometimes used to describe a computer-assisted telephone interview. The commonly used industry term is CATI, or Computer-Assisted Telephone Interviewing. The interviewer asks the questions over the phone and records the answers using a computer-based questionnaire.

Does Political Metrics provide CATI surveys in India?

Political Metrics provides CATI survey services for political research and commercial market research. Projects can be planned for selected states, regions or wider India-level coverage, depending on the research objective, sample requirements and available respondent contact data.

What types of research can be conducted through CATI?

CATI can be used for political opinion surveys, voter research, public opinion studies, market research, consumer behaviour, brand awareness, customer satisfaction, product feedback and institutional research.

What is the difference between CATI and a field survey?

CATI interviews are conducted over the telephone. Field surveys involve interviewers meeting respondents in person. The right method depends on the target population, research questions, available contact details, coverage needs and the nature of the study.

Can CATI surveys cover multiple states and languages?

Yes. A CATI project can be planned across multiple states and selected languages. The languages, interviewer requirements, respondent sample and calling plan should be agreed before the survey begins.

How do you monitor the progress of a CATI survey?

Survey progress can be reviewed through dashboards that show calls attempted, completed interviews, pending callbacks, call outcomes, sample progress and quality checks. The exact dashboard depends on the survey system and the reporting requirements.

What information is included in a CATI survey report?

A CATI report can include survey methodology, sample details, respondent profiles, question-wise responses, charts, response comparisons and key observations. The final report is prepared around the agreed research objectives.

How do I choose a top CATI survey company in India?

Compare companies on their research planning, questionnaire design, interviewer training, calling process, quality monitoring, sample management and reporting. It is also useful to understand how they handle different languages, regional coverage and the data required for your project. Ask for a clear scope and methodology before starting.

How can I get a CATI survey quotation?

Share the research objective, target locations, proposed sample size, number of questions, languages and expected timeline. Political Metrics can review these requirements and discuss a suitable survey scope and quotation.

Planning a CATI survey in India?

Whether you need a political opinion survey, a nationwide market research study, consumer feedback or customer satisfaction research, discuss your requirements with Political Metrics.

Survey scope, sample design, respondent contact data, permissions and reporting requirements are confirmed for each project.

Discuss Your CATI Survey Requirements
All it starts with communication

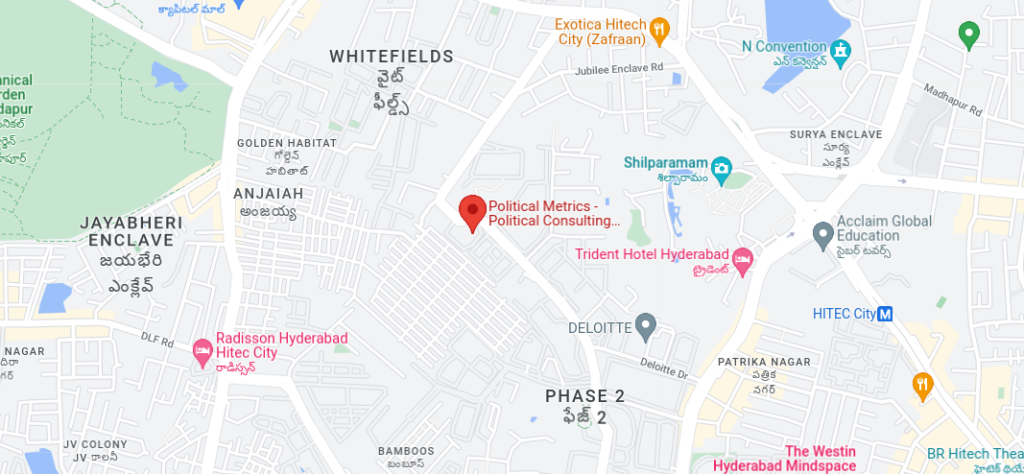
Come visit us!

Political Metrics is a India’s leading political strategy consulting firm specialises in Political PR, Surveys (pre,exit & post poll), Election Campaign Management, Political Party Registration, Political Advisory, Campaign War Room, Political Intelligence, Analytics, Digital & Social Media Management.

You can also have a chat with us on WhatsApp