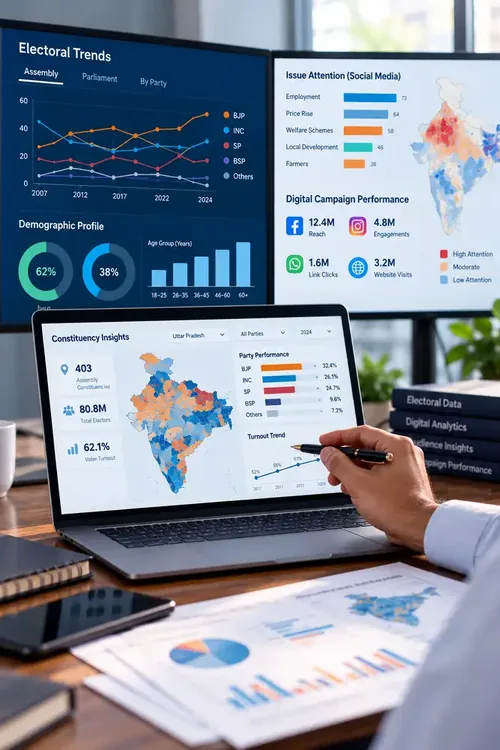
Understand political trends, assess constituency-level
dynamics and interpret public opinion through structured
research and data analysis. Political Metrics helps political
parties, candidates and campaign teams make informed decisions
through political analytics, voter research and actionable
intelligence across India.
Political Research · Constituency Intelligence · Voter Analysis ·
Electoral Trends · Campaign Strategy
Political analytics in India
Political data, connected to clearer decisions.
Political Metrics builds analytics dashboards that connect past and present electoral data with constituency context, issue attention and digital campaign activity, so that social, web, SMS and WhatsApp performance sit in one structured view.
Political Intelligence OverviewIllustrative layout, sample values only
DEMO DATA
Election cycles compared04Longitudinal
Constituency profiles24Sample set
Issue themes08Tracked
Data streams05Integrated
Electoral index by cycle (sample)
Channel mix (sample)
Illustrative sample dashboard. Not live information, actual election results or a performance claim.
Capabilities
Core analytics services, extended to fit your campaign.
Political Metrics turns electoral records, constituency context and digital campaign data into dashboards, comparisons and analytical reporting. The services below are our core modules. Most engagements combine several of them, and we extend or build new ones around your constituency, election type, data sources and reporting needs. Available detail depends on data quality, source access and correctly configured tracking.
Electoral data
Historical electoral analysis
Compare vote share, turnout, party performance and constituency change across election cycles.
Booth level
Booth-level analysis
Rank booths by strength, swing and turnout to see where support is consistent and where it is slipping.
Scenarios
Swing and scenario modelling
Test what-if cases on turnout and vote transfer, with every assumption stated and open to challenge.
Place and people
Constituency profiling
Combine aggregate demographic, geographic and local characteristics with electoral records.
Mapping
Geo-spatial mapping
Map results, swing and engagement by constituency, ward or booth to show spatial patterns at a glance.
Dashboards
Interactive political dashboards
Tailored views with filters, comparison tables and clearly defined indicators for ongoing review.
Issue signals
People pulse and issue tracking
Monitor topics, online discussion and aggregate audience interests from permitted data as attention shifts.
Media
News and media monitoring
Track coverage volume, themes and tone across selected news and digital sources over time.
Social
Social media analytics
Reach, interactions, content performance, topic patterns and available sentiment indicators.
Competitive
Opposition and competitor tracking
Compare your digital footprint, messaging themes and engagement with other parties and candidates.
Web
Website and web analytics
Traffic sources, landing pages, visitor journeys, events and conversions on campaign sites.
Messaging
SMS and WhatsApp insights
Delivery reports, tracked clicks, responses and follow-on website activity, as providers allow.
Attribution
UTM and URL parameter analysis
Link visits and events to tagged sources, campaigns, content and audience segments.
Survey integration
Ground-survey data integration
Bring opinion survey and field-report data into the same view as electoral and digital indicators.
Reporting
Briefings and war-room reports
Concise weekly and event-driven briefings that highlight changes, exceptions and what to verify next.
Analytics workflow
From scattered data to a decision-ready view.
A structured process keeps dashboards focused on real questions, clear definitions and evidence that can be checked.
01
Frame the question
Define the decision, period, geography and metrics.
02
Connect the sources
Review electoral records, demographic data, platform reports and tracking.
03
Validate and visualise
Align fields, check gaps, document definitions and build comparisons.
04
Interpret and refine
Separate observed signals from assumptions and refine as questions evolve.
Sources, refresh rates and integrations are confirmed per engagement. Digital signals may not represent the whole electorate, and associations do not establish causation.
From data to interpretation
See the relationships behind the numbers.
Instead of reading each spreadsheet, platform report or campaign link in isolation, teams can compare indicators across places and periods, spot meaningful changes and decide what to investigate next.
Historical directionCompare outcomes across cycles, with boundaries and definitions checked.
Constituency contextRead local characteristics alongside electoral indicators.
Digital attentionTrack engagement, issue activity, search interest and site behaviour.
Campaign attributionUse UTM tags to link known sources to visits and events.
The result is a practical base for clearer reporting: what changed, where, which signals appear connected, and what to verify before drawing a conclusion.
Political context, data and analysis
Sample analytics
Sample dashboards for electoral, social, paid, messaging and competitive data.
Pick a tab to explore. Each exhibit shows how electoral history, constituency comparison, issue attention and digital activity can be organised for decision-makers. All figures are fictional placeholders for demonstration.
Exhibit 1
Party vote-share index moves differently in each cycle
Sample index by election cycle, not actual vote share
Series ASeries BSeries C
Analytical question: Is each trend strengthening, weakening or stabilising, and did boundaries, turnout or data coverage change between cycles?
Exhibit 2
Swing varies sharply across neighbouring constituencies
Sample change vs prior cycle, percentage points, 24 areas
Analytical question: Does tone match the narrative?
Exhibit 30
Crisis and rumour monitor: a topic spiked on day 6
Sample mentions per hour (hundreds)
Alert fired at 4x the 7-day average.
Action: verify the claim, then prepare a response.
Exhibit 31
Where the rumour started
Sample share of first 100 mentions by source type
Forwarded messages46%
Small pages28%
News sites14%
Others12%
Read with care: early sources show who spread it, not who made it.
Exhibit 32
War-room summary: five numbers and three alerts
Sample one-page view for the candidate
Reach (7d)2.4M+8%
Engaged visits9,800+5%
Cost per actionRs 31-6%
Net sentiment+12Indicative
Alert 1 Rumour on topic Y is trending. Check source.
Alert 2 Booth 27 volunteer coverage is below plan.
Alert 3 WhatsApp read rate fell 9 points.
Analytical question: What needs a decision today?
Exhibit 33
Weekly report preview: what clients actually receive
Sample one-page briefing layout
Week42Sample
Sections5Summary, digital, ads, ground, risks
1. What changed this week
2. Digital and ads
3. Risks and next steps
Output: a PDF or email every Monday.
Frequently asked questions
Answers before you start.
How political analytics, election data services, data sources and tracking work at Political Metrics.
Political analytics is the structured study of electoral results, constituency context, public attention and digital campaign activity. For campaigns in India, it shows what changed between election cycles, where support is strengthening or slipping, and which areas or issues need attention before decisions are made.
A political analytics company turns electoral records, demographic data, survey findings and digital platform reports into dashboards, comparisons and briefings. Political Metrics works with candidates, parties and research teams on historical election analysis, booth-level review, issue tracking, digital performance and reporting.
Our core services include historical electoral analysis, booth-level analysis, swing and scenario modelling, constituency profiling, geo-spatial mapping, issue and media monitoring, social media and web analytics, SMS and WhatsApp insights, UTM tracking, survey integration and war-room reporting. We also extend or combine modules to fit your requirement.
Yes. The listed services are core modules. We configure, combine or extend them for Assembly, Lok Sabha, MLC, Zilla Parishad, municipal or ward elections, based on the geography, available data and the decisions you need to make. Scope is confirmed before work begins.
We work with official electoral records, aggregate demographic and geographic data, survey and field-report data, social and ad platform reports, website analytics, and SMS and WhatsApp provider reports. What is available depends on source access, permissions and data quality.
Booth-level analysis ranks polling booths by past performance, swing and turnout. It shows where support is consistent, where it is weak and which booths deserve priority for volunteer coverage, outreach or verification.
UTM tags are added to the links you share, naming the source, medium and campaign. When someone clicks, your website analytics groups the visit under that tag, so you can compare SMS, WhatsApp, Google and paid social traffic. Untagged links usually appear as direct traffic.
No. We use aggregate data only, such as age bands, booth-level totals and channel-level results. We do not show individual voter profiles or phone numbers, and audience signals are never presented as labels for individuals.
Analytics can show trends and test what-if scenarios, such as how turnout or vote transfer changes a margin. It cannot guarantee a result. Every scenario should state its assumptions and uncertainty, and observed patterns do not by themselves prove causation.
Start with the constituency or region, the time period, your main questions and access to relevant accounts such as website analytics or ad accounts. We then confirm data sources, scope, refresh frequency and the dashboard views you need.
Make your political data easier to understand.
Discuss an electoral analytics dashboard, constituency comparison, digital performance analysis or an integrated political data project with Political Metrics.
Sample analytics are illustrative. Actual reporting depends on source quality, permissions, platform access and agreed scope.
Political Metrics is a India’s leading political strategy consulting firm specialises in Political PR, Surveys (pre,exit & post poll), Election Campaign Management, Political Party Registration, Political Advisory, Campaign War Room, Political Intelligence, Analytics, Digital & Social Media Management.