Skip to content
top political research company
Political Research | Voter Research | Regional Research

Understanding Politics, Voters and Regions Across India.

Know how politics works in your constituency before you plan a single move. Political Metrics studies the people, the issues and the local power equations behind every election, so that parties, candidates and campaign teams act on research and not on assumption, from one ward to an entire state.

Political Research
Voter Research
Region-wise Research
Election Research
Discuss Your Research Requirements →
Constituency Research · Voter Understanding · Regional Studies · Issue Research · Candidate Research
Political and election research in India

Research that explains why politics works the way it does.

Political Metrics studies the voters, communities, regions, parties and issues behind every contest, so that leaders and campaign teams plan on understanding and not on assumption. From a single ward to an entire state, our research looks at the place, the people, the power equations and the narratives that decide outcomes.

Political researchVoter researchRegional researchPsephology
Political Research FrameworkFour lenses we apply to every study
FRAMEWORK
PlaceRegion, constituency, development and local history
PeopleVoters, communities, caste and religious factors, expectations
PowerParties, leaders, candidates, alliances and psephology
NarrativeIssues, emerging trends, manifestos and leader positioning

Illustrative framework. It describes how studies are structured and is not live information or a findings claim.

Sample research outputs

What political and election research looks like in a report.

Pick a tab to explore. Each exhibit shows a format used in a research report on voters, communities, regions, development, narratives or leader positioning. All names, labels and figures are fictional placeholders for demonstration.

Exhibit 1

Voter segments respond to different issues

Sample issue-concern intensity by voter segment, qualitative scale

Voter researchSegment view
JobsWelfare schemesSafetyLocal servicesLeadership trust
First-time votersHighLowMediumMediumMedium
Women votersMediumHighHighMediumMedium
Farmers and rural householdsMediumHighLowHighMedium
Urban professionalsHighLowMediumMediumHigh
Senior citizensLowHighMediumHighMedium
HighMediumLow
Analytical question: Which segments can be persuaded on which issue, and which message reaches whom?
Exhibit 2

Community equations: no single block decides the seat

Sample community composition of an electorate, placeholder labels

Community A 28%B 22%C 18%D 14%E 10%F 8%

Real studies use verified, aggregate community composition. Labels here are placeholders and do not describe any group.

Read with care: community is one factor among many, and voting is rarely uniform inside any group.
Exhibit 3

Why people vote the way they do

Sample decision-driver index, higher means stronger influence

Local development
78
Candidate image
71
Party and leader appeal
66
Welfare delivery
61
Community factors
49
Local alliances
38
Analytical question: Which drivers matter most in this seat, and how do they differ by segment?
Exhibit 4

Long-run party strength differs sharply by region

Sample psephology view, party strength by region across four cycles

PsephologyRegion-wiseFour cycles
Cycle 1Cycle 2Cycle 3Cycle 4
Region AStrongStrongLeaningLeaning
Region BSwingWeakSwingStrong
Region CWeakWeakWeakSwing
Region DLeaningSwingSwingWeak
StrongLeaningSwingWeakVery weak
Analytical question: Is a region's shift lasting or a one-cycle effect, and what local context explains it?
Exhibit 5

Seat typology: how constituencies split

Sample share of seats in a state by seat type

  • Stronghold24%
  • Leaning28%
  • Swing22%
  • Contested16%
  • Opposition-held10%
Analytical question: Where should effort go, and which seats are decided by a few thousand votes?
Exhibit 6

Comparative constituency report

Sample side-by-side of three fictional seats

ParameterSeat XSeat YSeat Z
Seat typeSwingLeaningStronghold
Swing historyHighModerateLow
Incumbent standingWeakMixedStrong
Community mixFragmentedTwo-blockDominant block
Top local issueWaterJobsRoads
Development gapWideMediumNarrow
Analytical question: What explains why two similar seats behave differently?
Exhibit 7

Constituency development report: promised vs delivered

Sample index by sector, as seen in a development review

Constituency developmentPromise vs delivery
Roads and transport
62
Drinking water
41
Health services
48
Education
52
Jobs and livelihoods
30
PromisedDeliveredWidest gaps
Analytical question: Where is the gap between promise and delivery widest, and do residents feel it the same way?
Exhibit 8

Manifesto research: what people want vs what is promised

Sample priority-gap map of public issues

Priority gapWell coveredLow priorityOver-promised LowManifesto coverageHigh JobsWaterRoadsWelfareShowcaseOther
Analytical question: Which high-priority issues does no manifesto address with a specific commitment?
Exhibit 9

Issue priorities differ across regions

Sample top three issues by region

RegionFirstSecondThird
Region AWaterRoadsJobs
Region BJobsEducationHealth
Region CFarm pricesIrrigationPower
Region DTransportHousingSafety
Analytical question: Should one message run statewide, or does each region need its own?
Exhibit 10

Emerging narratives: what is rising and what is fading

Sample narrative tracker, as it appears in a narrative report

Emerging trendsNarrative report
NarrativeWhere it beganMomentumSegments it reaches
Jobs for local youthCampus and small-town groups↑ RisingFirst-time voters, families
Water and basic servicesWard-level grievances↑ RisingUrban poor, rural households
Welfare scheme deliveryParty outreach→ StableWomen, senior citizens
Leadership change debateMedia commentary↓ FadingUrban professionals
Analytical question: Which narrative is gaining ground, and who is carrying it?
Exhibit 11

A narrative follows a life cycle

Conceptual curve, not measured data

EmergingPeakFadingWindow torespond
Analytical question: Is the window to shape this narrative still open?
Exhibit 12

Leader brand positioning map

Sample voter perception of four fictional leaders

DistantApproachabilityAccessibleStrongWeakDelivery Open space Leader ALeader BLeader CLeader D
Analytical question: Which position is unclaimed, and can this leader credibly own it?
Exhibit 13

From research question to method

How a brief is turned into a research design

Research questionMethodOutput
Why did we lose these booths?Post-poll review and field interviewsBooth-level diagnostic note
What do voters in this region really want?Focus groups and community discussionsIssue and expectation report
How do communities shape this seat?Desk research and local expert consultationsCommunity equation brief
What should the manifesto promise?Issue research and promise-gap reviewManifesto research paper
How is this leader perceived?Perception interviews and media reviewBrand positioning report
Analytical question: Is the method matched to the question, or only to what is easiest to collect?
Exhibit 14

What a research report looks like

Sample outlines of three report types

Report 1
Constituency dossier
  1. History and electoral record
  2. Voters and communities
  3. Development review
  4. Key issues
Report 2
Comparative constituency report
  1. Seats compared
  2. Why they differ
  3. Lessons for strategy
  4. Priority ranking
Report 3
Narrative and trends brief
  1. Emerging narratives
  2. Who carries them
  3. Risks and openings
  4. Recommended response
Output: a written report and a short briefing note your team can act on.
Capabilities

Fifteen research services for leaders, parties and campaign teams.

Political Metrics combines desk research, field interviews, community discussions and expert consultation into clear reports on voters, regions and contests. Scope, methods and sources are confirmed for each engagement.

Landscape

Political landscape research

Parties, leaders, alliances and the power equations that shape a region or constituency.

Voters

Voter research

Who the voters are, what they expect and what moves their choice, by segment and by place.

Regions

Region-wise research

District, region and state studies that show how politics differs from one area to the next.

Psephology

Psephology and electoral behaviour

Past results, turnout, swing and seat typology read together to explain how seats move.

Community

Caste, community and religious factor research

Aggregate study of how community composition and local equations influence voting, reported neutrally.

Development

Constituency development reports

A review of roads, water, health, education and jobs, comparing promises with delivery.

Trends

Emerging trends research

Early signals of shifting concerns, new issues and changing voter mood in a region.

Narrative

Narrative reports

Which narratives are rising or fading, who carries them and how to respond.

Manifesto

Manifesto development research

A map of what people want against what is promised, so that commitments are specific and credible.

Brand

Politician brand positioning research

How a leader is perceived on trust, access, delivery and vision, and where to position next.

Comparison

Comparative constituency reports

Seats studied side by side to show why similar constituencies behave differently.

Issues

Issue and policy research

Local grievances, scheme feedback and governance gaps, documented with evidence.

Profiles

Candidate and opponent research

Background, public record, strengths and weaknesses from open and verifiable sources.

Mapping

Stakeholder and influencer mapping

Community leaders, opinion makers and local networks that matter in a constituency.

Ground

Ground intelligence and verification

Field reports that check what is really happening on the ground before decisions are taken.

From research to decisions

Understand the constituency before you plan the campaign.

A number can say where a party stands, but not why. Research connects the place, the people, the power equations and the narratives, so that a leader knows what to say, where to be present and which issues to own.

PlaceHistory, region and development, read together.
PeopleVoters and communities, in their own words.
PowerParties, leaders and how seats have moved.
NarrativeIssues, trends and how a leader is seen.

The result is a practical base for strategy: what is happening, why it is happening and what to do about it.

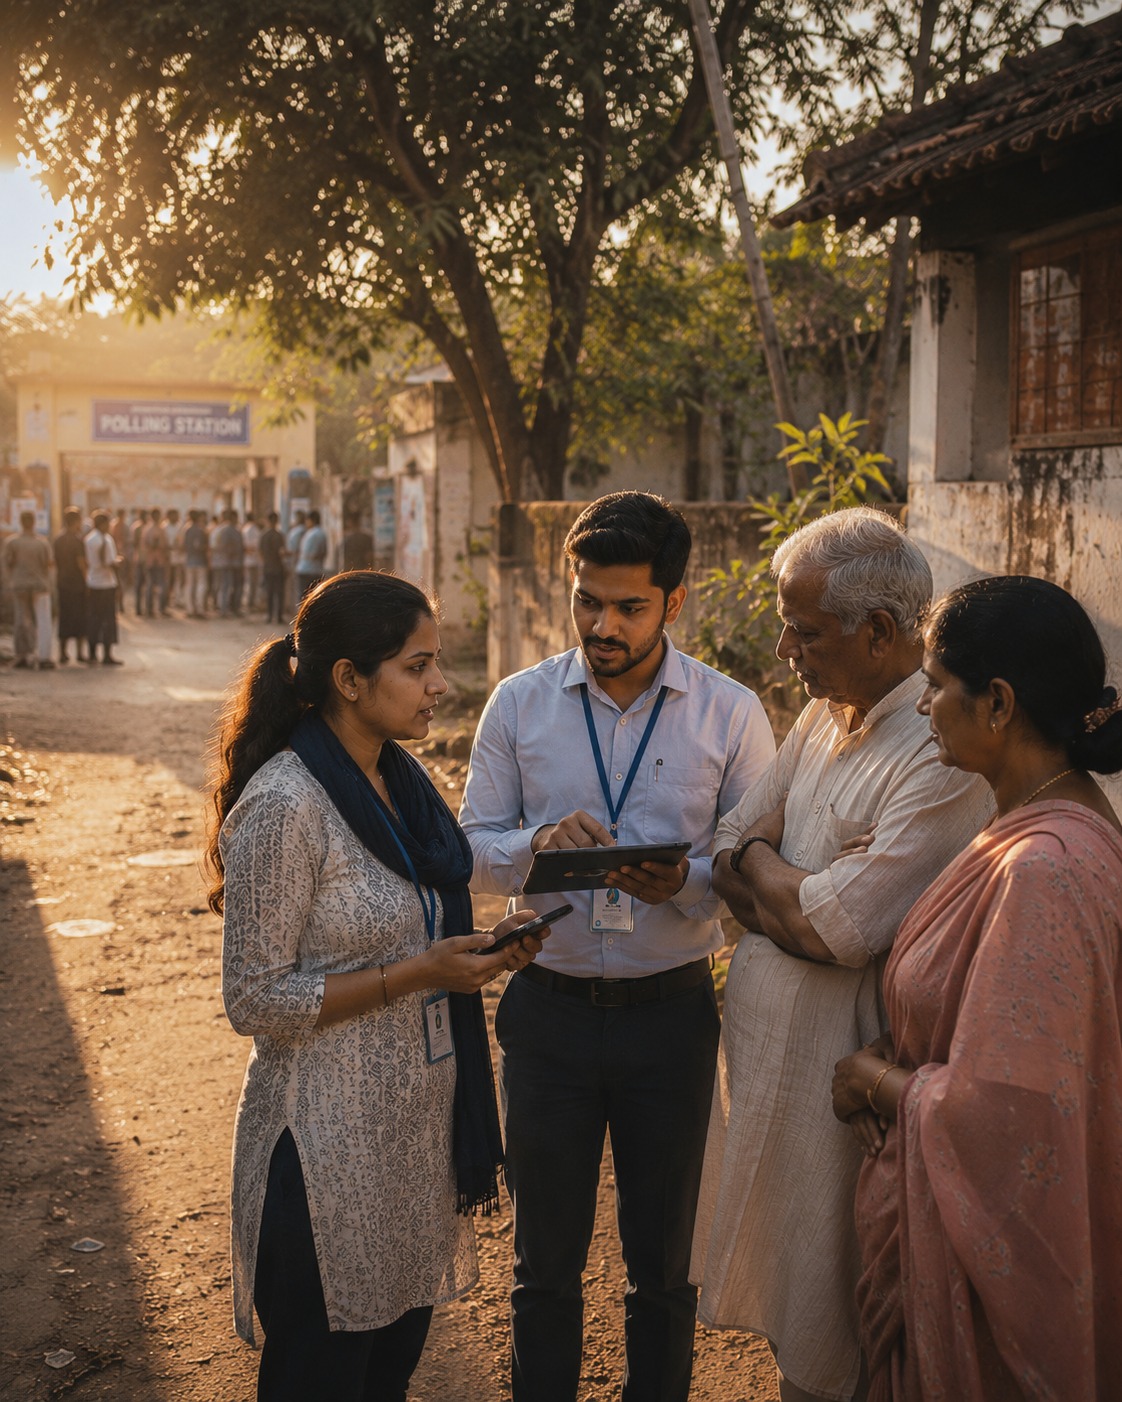
Political Metrics field team speaking with voters as part of political and voter research in India
Ground-level political research
Research approach

From a question to a report you can act on.

Every study starts with the decision it must support and uses the methods that fit the question.

01

Frame the question

Define the decision, the geography and what the research must answer.

02

Desk and archival research

Study results, records, reports, media and earlier research on the area.

03

Field and community research

Interviews, discussions and expert consultations with people on the ground.

04

Synthesise and advise

Turn findings into a clear report and a briefing your team can use.

NeutralFindings are reported as found, not as hoped.
VerifiedSources are checked and cross-referenced.
AggregateCommunity and voter findings are never about individuals.
ConfidentialShared only with the client team that commissioned it.

Sources, methods and timelines are confirmed per engagement. Research findings describe patterns and perceptions and do not guarantee any electoral outcome.

Frequently asked questions

Answers before you start.

How political and election research works at Political Metrics, and how it differs from surveys and analytics.

Political research is the structured study of voters, communities, regions, parties, leaders and issues, to explain how and why politics works the way it does in a place. It gives leaders and campaign teams an evidence base for decisions, before and between elections.

Our election surveys measure opinion through structured polling. Our political analytics connects electoral, digital and campaign data into dashboards. Political research is the wider study that explains the context and the reasons behind those numbers, through desk research, field interviews, community discussions and expert consultation.

Psephology is the study of elections and voting behaviour. It uses past results, turnout, swing and constituency patterns to understand how and why seats move between parties.

Where they shape local politics, yes. We study community composition and its influence on voting at an aggregate level, alongside development, candidate and party factors. The aim is to understand constituency dynamics and community concerns, never to profile individuals. Findings are reported neutrally and kept confidential to the client.

It reviews local infrastructure and services such as roads, water, health, education and jobs, compares promises with delivery, and records what residents say about each. It shows a leader or candidate where the development gap is widest.

It maps what people in a constituency or region want against what parties already promise. It highlights priority gaps, so that manifesto commitments are specific, credible and relevant to local needs.

It studies how a leader is seen by different voter groups on trust, accessibility, delivery and vision, and how that compares with rivals. The result is a positioning recommendation grounded in perception and not in assumption.

No. Every exhibit uses fictional sample data and placeholder labels to show report formats and the questions they answer. They are not real findings, election results or a claim about any community, region or leader.

Share the constituency or region, your timeline and the decisions the research must support. We will revert with a recommended scope, methods and report plan.

Understand your constituency before you plan your campaign.

Discuss a voter study, regional research, a constituency development report, manifesto research or leader positioning research with Political Metrics.

Sample exhibits are illustrative. Actual research depends on scope, access to the ground and agreed methods.

Discuss a research project
All it starts with communication

Come visit us!

Political Metrics is a India’s leading political strategy consulting firm specialises in Political PR, Surveys (pre,exit & post poll), Election Campaign Management, Political Party Registration, Political Advisory, Campaign War Room, Political Intelligence, Analytics, Digital & Social Media Management.

You can also have a chat with us on WhatsAppÂ